
With warmer temperatures globally and many schools across North America and Europe observing summer vacation, summer is a peak season for travel around the world. Yet international summer travel plummeted during the COVID-19 pandemic due to travel bans, distancing guidelines, and event cancellations. Fortunately, after several summers of reduced travel, international travel is expected to fully recover in 2024. According to the World Economic Forum, international tourism reached 88% of 2019 levels globally in 2023, edging closer to pre-pandemic figures.
While travel to several top international destinations—such as France, Spain, Greece, and the UAE—either fully or nearly recovered in 2023 compared to 2019 levels, travel to the U.S. lags behind. According to the Department of Commerce’s Survey of International Air Travelers, an estimated 31 million visitors came to the U.S. in 2023 from overseas regions, down from 40 million in 2019. This decline has resulted in a slight drop in the U.S. share of the total global tourism market, from 5.4% to 5.3%.
The Economic Impact of International Travel to the U.S.
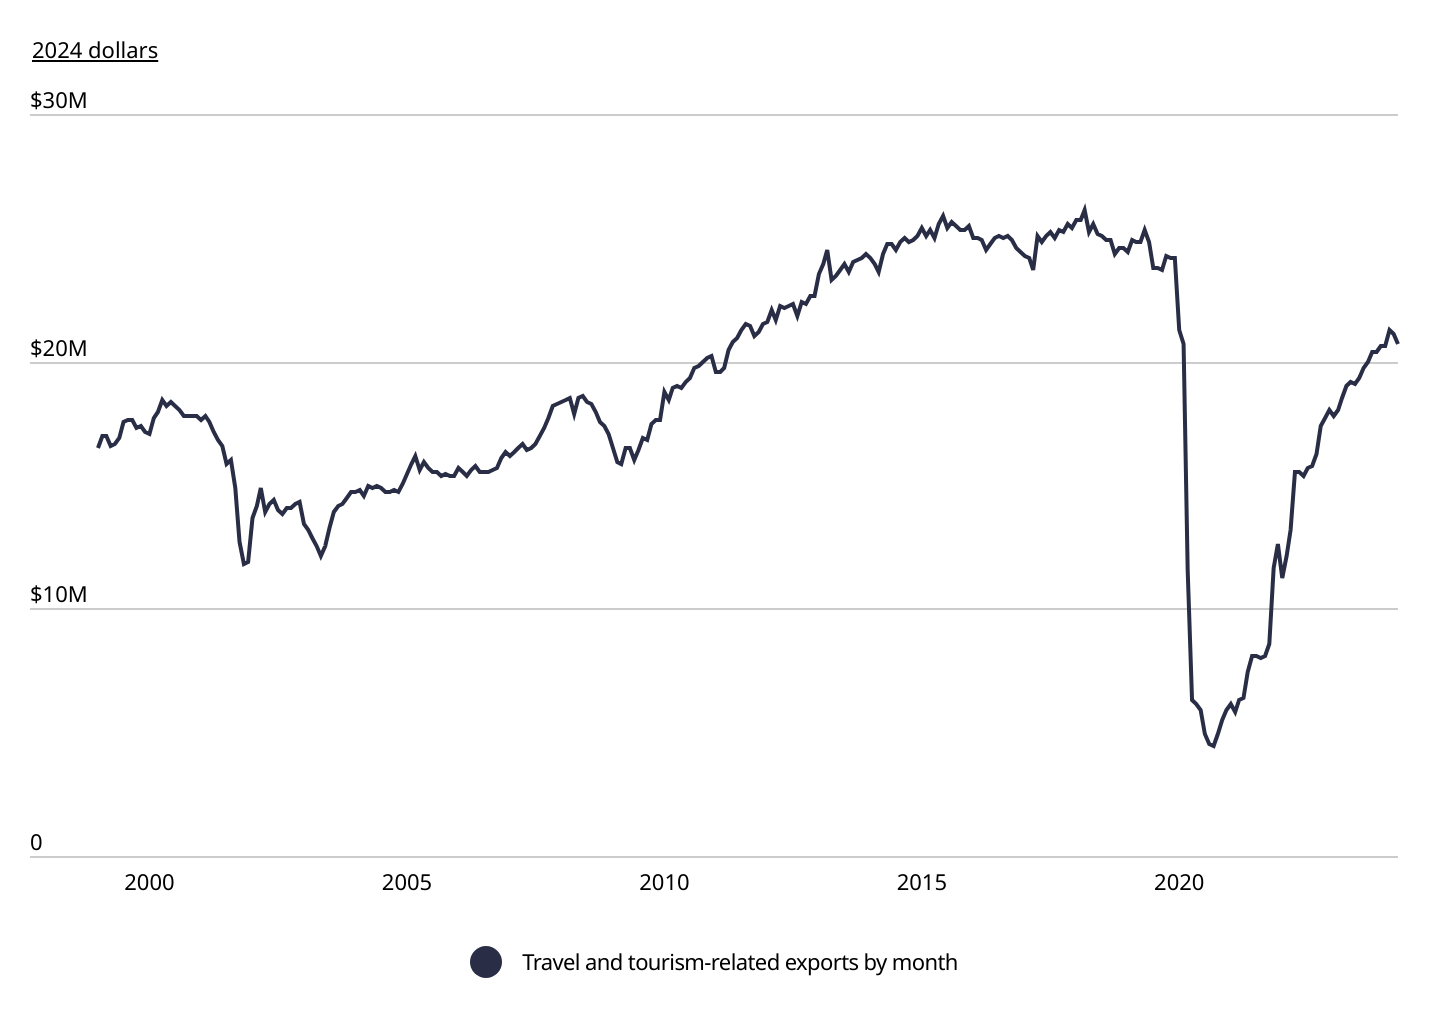
Experts attribute America’s slower recovery to several factors that complicate travel for international visitors, such as strict visa requirements and lengthy customs wait times. These issues are significant because international tourism is a vital part of the U.S. economy, with foreign tourists spending billions each year to experience the country’s cities, national parks, and historical landmarks.
In 2023, international tourism generated over $230 billion in exports (adjusted to 2024 dollars), accounting for approximately 22% of all U.S. services exports globally.
What Attracts International Visitors to the U.S.?
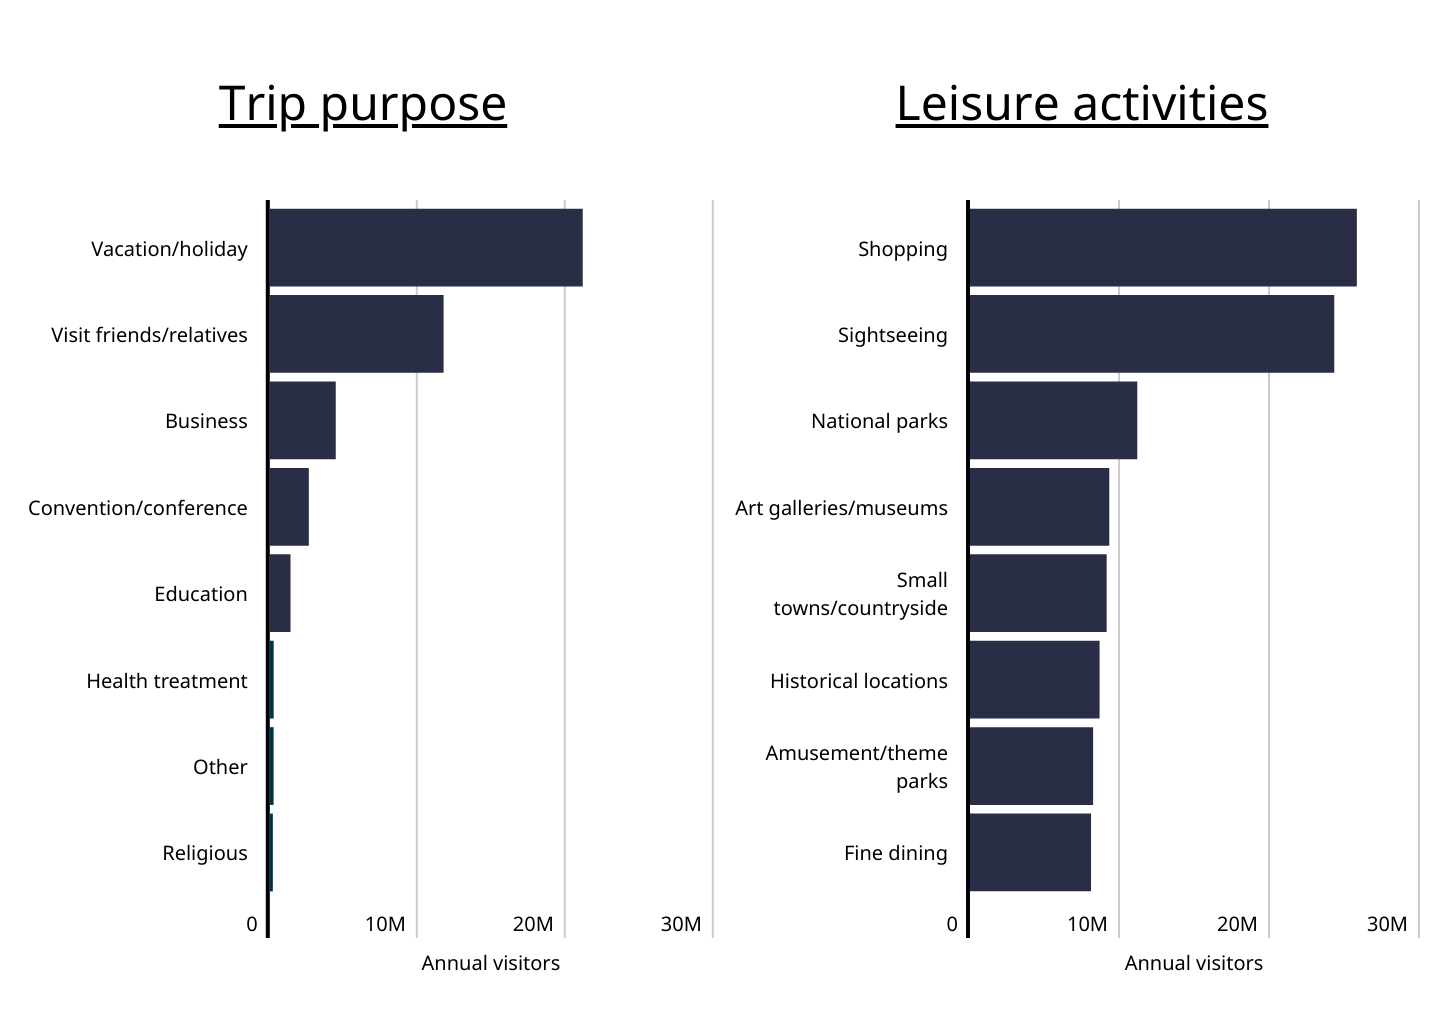
Despite the slowdown in international tourist traffic, the U.S. remains a popular destination for various reasons. While most international visitors come for vacations or holidays, other top reasons include visiting friends and relatives, business, attending conferences or conventions, and education. Last year, over 21 million international travelers cited vacation as their primary reason for visiting the U.S., representing 67% of international visitors. Visiting friends and relatives was the second most popular reason, attracting nearly 11.8 million visitors, or 37% of international tourists.
Once in the U.S., the most popular activity for international tourists is shopping, with nearly 25.8 million visitors (82%) engaging in it. Sightseeing is a close second, with almost 24.3 million tourists (77.2%) participating. Other popular activities include visiting national parks, art galleries and museums, small towns, historical locations, and theme parks.
TRENDING
Embark on a lavish escape to New York City, where you will discover exquisite dining, chic boutiques, and unparalleled cultural experiences. Elevate your experience in one of the luxury hotels in NYC, with breathtaking views of the marvelous and historic city skyline.
International Tourism by State
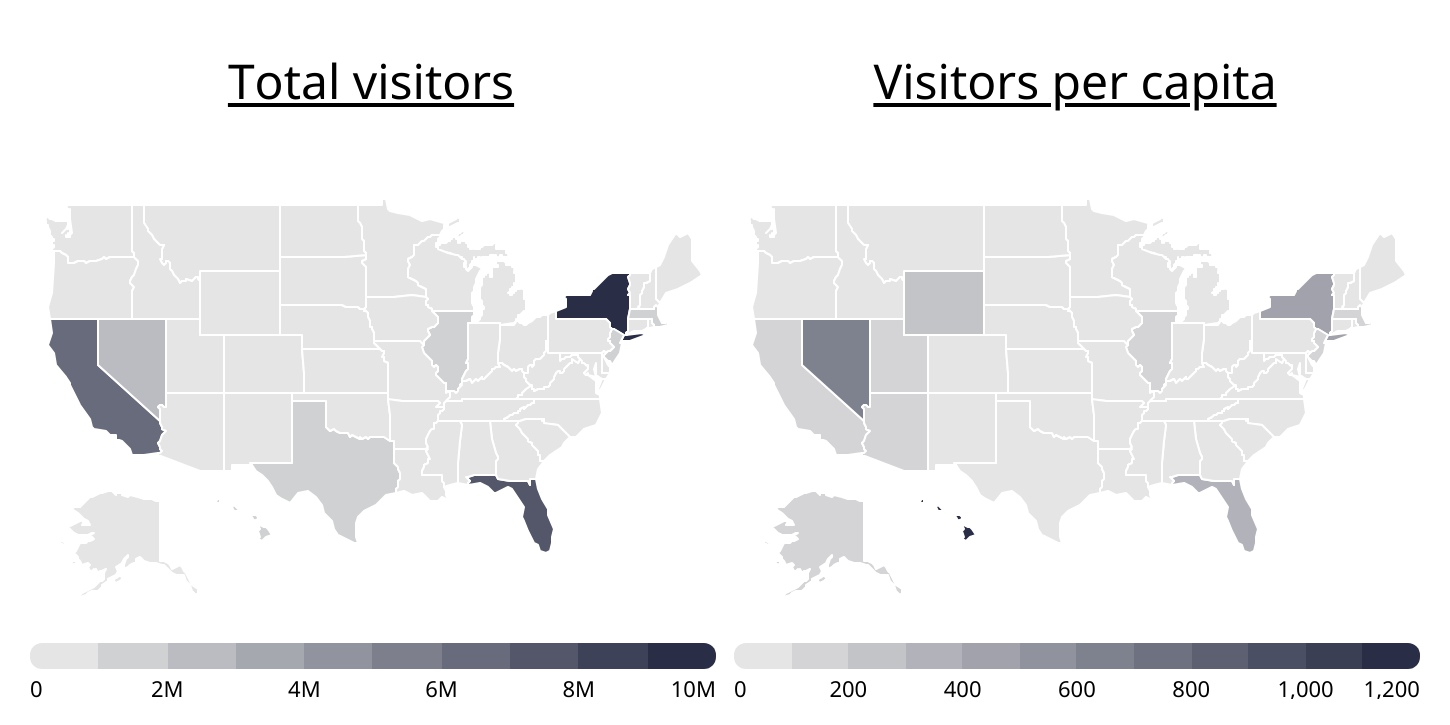
New York ranks first in international tourism, with over 9 million overseas travelers in 2023, drawn by its world-class shopping, iconic landmarks, and renowned museums. Florida follows closely, attracting 7.9 million visitors who come for its pristine beaches, vibrant theme parks, and diverse cultural offerings. California, with 6.3 million international tourists, entices visitors with its mild climate, scenic coastlines, and a mix of urban and natural attractions, including nine national parks.
While Nevada and Hawaii ranked fourth and sixth in total numbers, they boasted the highest visitor-to-resident ratios. Nevada saw 676 international visitors per 1,000 residents, and Hawaii attracted an impressive 1,158 visitors per 1,000 residents. Nevada lures tourists with its famous entertainment hubs and vibrant nightlife, particularly in Las Vegas, whereas Hawaii draws visitors with its stunning beaches, unique cultural heritage, and breathtaking landscapes.
Below is a breakdown of the top U.S. cities visited by international travelers. The analysis was conducted by Luxury Link—an online booking platform specializing in luxury travel—using data from the U.S. Department of Commerce. For additional information, refer to the methodology section below.
The Top-Visited U.S. Cities for Overseas Travelers

15. Dallas-Plano-Irving, TX
- Overseas visitors (2023): 655,000
- Overseas visitors per 1K residents (2023): 122
- Percentage of total U.S. overseas visitors (2023): 2.1%
- Percentage change in overseas visitors (2022–2023): +44.6%

14. San Diego-Carlsbad-San Marcos, CA
- Overseas visitors (2023): 655,000
- Overseas visitors per 1K residents (2023): 200
- Percentage of total U.S. overseas visitors (2023): 2.1%
- Percentage change in overseas visitors (2022–2023): +17.4%
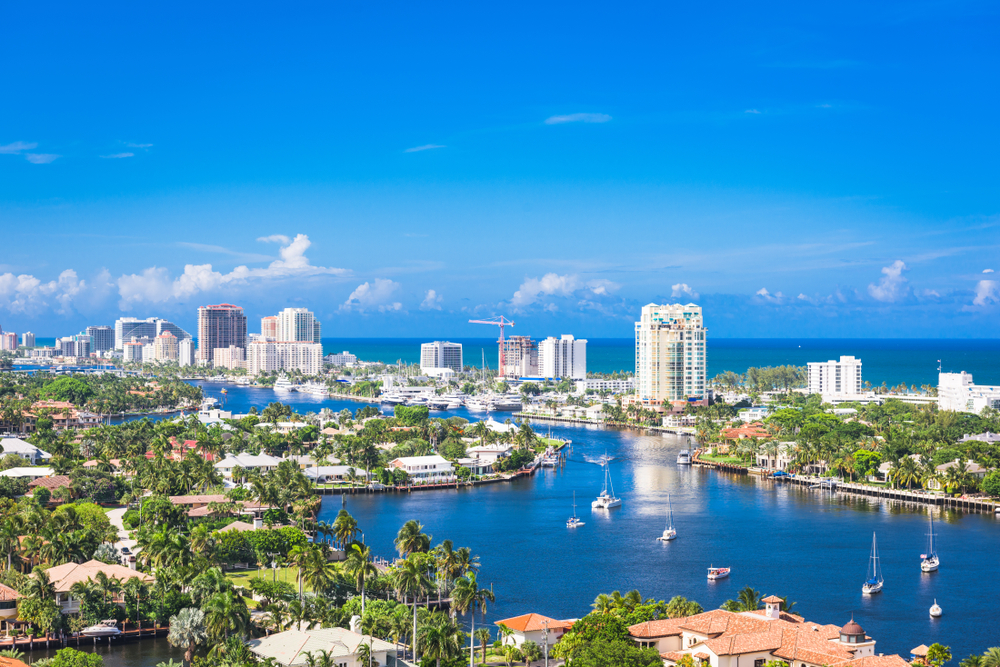
13. Fort Lauderdale-Pompano Beach-Deerfield Beach, FL
- Overseas visitors (2023): 749,000
- Overseas visitors per 1K residents (2023): 385
- Percentage of total U.S. overseas visitors (2023): 2.4%
- Percentage change in overseas visitors (2022–2023): +11.0%

12. Atlanta-Sandy Springs-Marietta, GA
- Overseas visitors (2023): 765,000
- Overseas visitors per 1K residents (2023): 123
- Percentage of total U.S. overseas visitors (2023): 2.4%
- Percentage change in overseas visitors (2022–2023): +111.3%

11. Houston-Sugar Land-Baytown, TX
- Overseas visitors (2023): 887,000
- Overseas visitors per 1K residents (2023): 121
- Percentage of total U.S. overseas visitors (2023): 2.8%
- Percentage change in overseas visitors (2022–2023): +48.8%

10. Boston-Quincy, MA
- Overseas visitors (2023): 1,152,000
- Overseas visitors per 1K residents (2023): 569
- Percentage of total U.S. overseas visitors (2023): 3.7%
- Percentage change in overseas visitors (2022–2023): +56.1%

9. Honolulu, HI
- Overseas visitors (2023): 1,322,000
- Overseas visitors per 1K residents (2023): 1,328
- Percentage of total U.S. overseas visitors (2023): 4.2%
- Percentage change in overseas visitors (2022–2023): +85.9%

8. Chicago-Joliet-Naperville, IL
- Overseas visitors (2023): 1,413,000
- Overseas visitors per 1K residents (2023): 199
- Percentage of total U.S. overseas visitors (2023): 4.5%
- Percentage change in overseas visitors (2022–2023): +33.2%

7. Washington-Arlington-Alexandria, DC-VA-MD-WV
- Overseas visitors (2023): 1,611,000
- Overseas visitors per 1K residents (2023): 253
- Percentage of total U.S. overseas visitors (2023): 5.1%
- Percentage change in overseas visitors (2022–2023): +38.0%

6. Las Vegas-Paradise, NV
- Overseas visitors (2023): 2,077,000
- Overseas visitors per 1K residents (2023): 894
- Percentage of total U.S. overseas visitors (2023): 6.6%
- Percentage change in overseas visitors (2022–2023): +25.1%

5. San Francisco-San Mateo-Redwood City, CA
- Overseas visitors (2023): 2,281,000
- Overseas visitors per 1K residents (2023): 1,483
- Percentage of total U.S. overseas visitors (2023): 7.3%
- Percentage change in overseas visitors (2022–2023): +31.2%

4. Orlando-Kissimmee-Sanford, FL
- Overseas visitors (2023): 3,518,000
- Overseas visitors per 1K residents (2023): 1,273
- Percentage of total U.S. overseas visitors (2023): 11.2%
- Percentage change in overseas visitors (2022–2023): +20.5%

3. Los Angeles-Long Beach-Glendale, CA
- Overseas visitors (2023): 3,603,000
- Overseas visitors per 1K residents (2023): 371
- Percentage of total U.S. overseas visitors (2023): 11.5%
- Percentage change in overseas visitors (2022–2023): +31.0%

2. Miami-Miami Beach-Kendall, FL
- Overseas visitors (2023): 4,365,000
- Overseas visitors per 1K residents (2023): 1,632
- Percentage of total U.S. overseas visitors (2023): 13.9%
- Percentage change in overseas visitors (2022–2023): +6.8%
PLAN YOUR NEXT VISIT
New York City is the ultimate destination for travelers who desire the finest that life has to offer—from world class restaurants to the dazzling performances on Broadway. Ensure your visit is nothing less than extraordinary in one of these 5 star hotels in New York City.

1. New York-White Plains-Wayne, NY-NJ
- Overseas visitors (2023): 8,890,000
- Overseas visitors per 1K residents (2023): 745
- Percentage of total U.S. overseas visitors (2023): 28.3%
- Percentage change in overseas visitors (2022–2023): +27.1%
Methodology
Data on international visitation to the United States was sourced from the U.S. Department of Commerce International Trade Association’s Survey of International Air Travelers (SIAT). For the purpose of this analysis, inbound visitors from Canada and Mexico were not included. Visitation statistics for individual locations do not sum to the national totals due to certain visitors traveling to multiple locations. Similarly, international visitors may list multiple purposes for their trip and multiple leisure activities undertaken on their trip. Per-capita visitation statistics for each location were calculated using the latest population data from the U.S. Census Bureau’s 2022 American Community Survey 1-Year Estimates. For each location, the percentage of total overseas visitors coming to the U.S. that visited the specific location was also calculated. The cities shown are major metropolitan statistical areas, and where applicable, metropolitan divisions tracked by the SIAT.